3. The screens
A screen is a JSON file in views/, named <model>.<kind>.json. Not a template, not a
component, no CSS.
Eight kinds are declarable. Here they all are, on the library module.
The list
{ "model": "library_title", "kind": "list", "fields": ["name", "author", "genre", "published_year", "isbn"]}model: library_titleviews: list: { columns: [name, author, genre, published_year, isbn] }The YAML file gathers all a model’s views; JSON puts one per file. And the key is called
columns here, fields there: the two formats never agreed, and it is reported.
view library_title list { columns name, author, genre, published_year, isbn}The same screen, one line per setting.
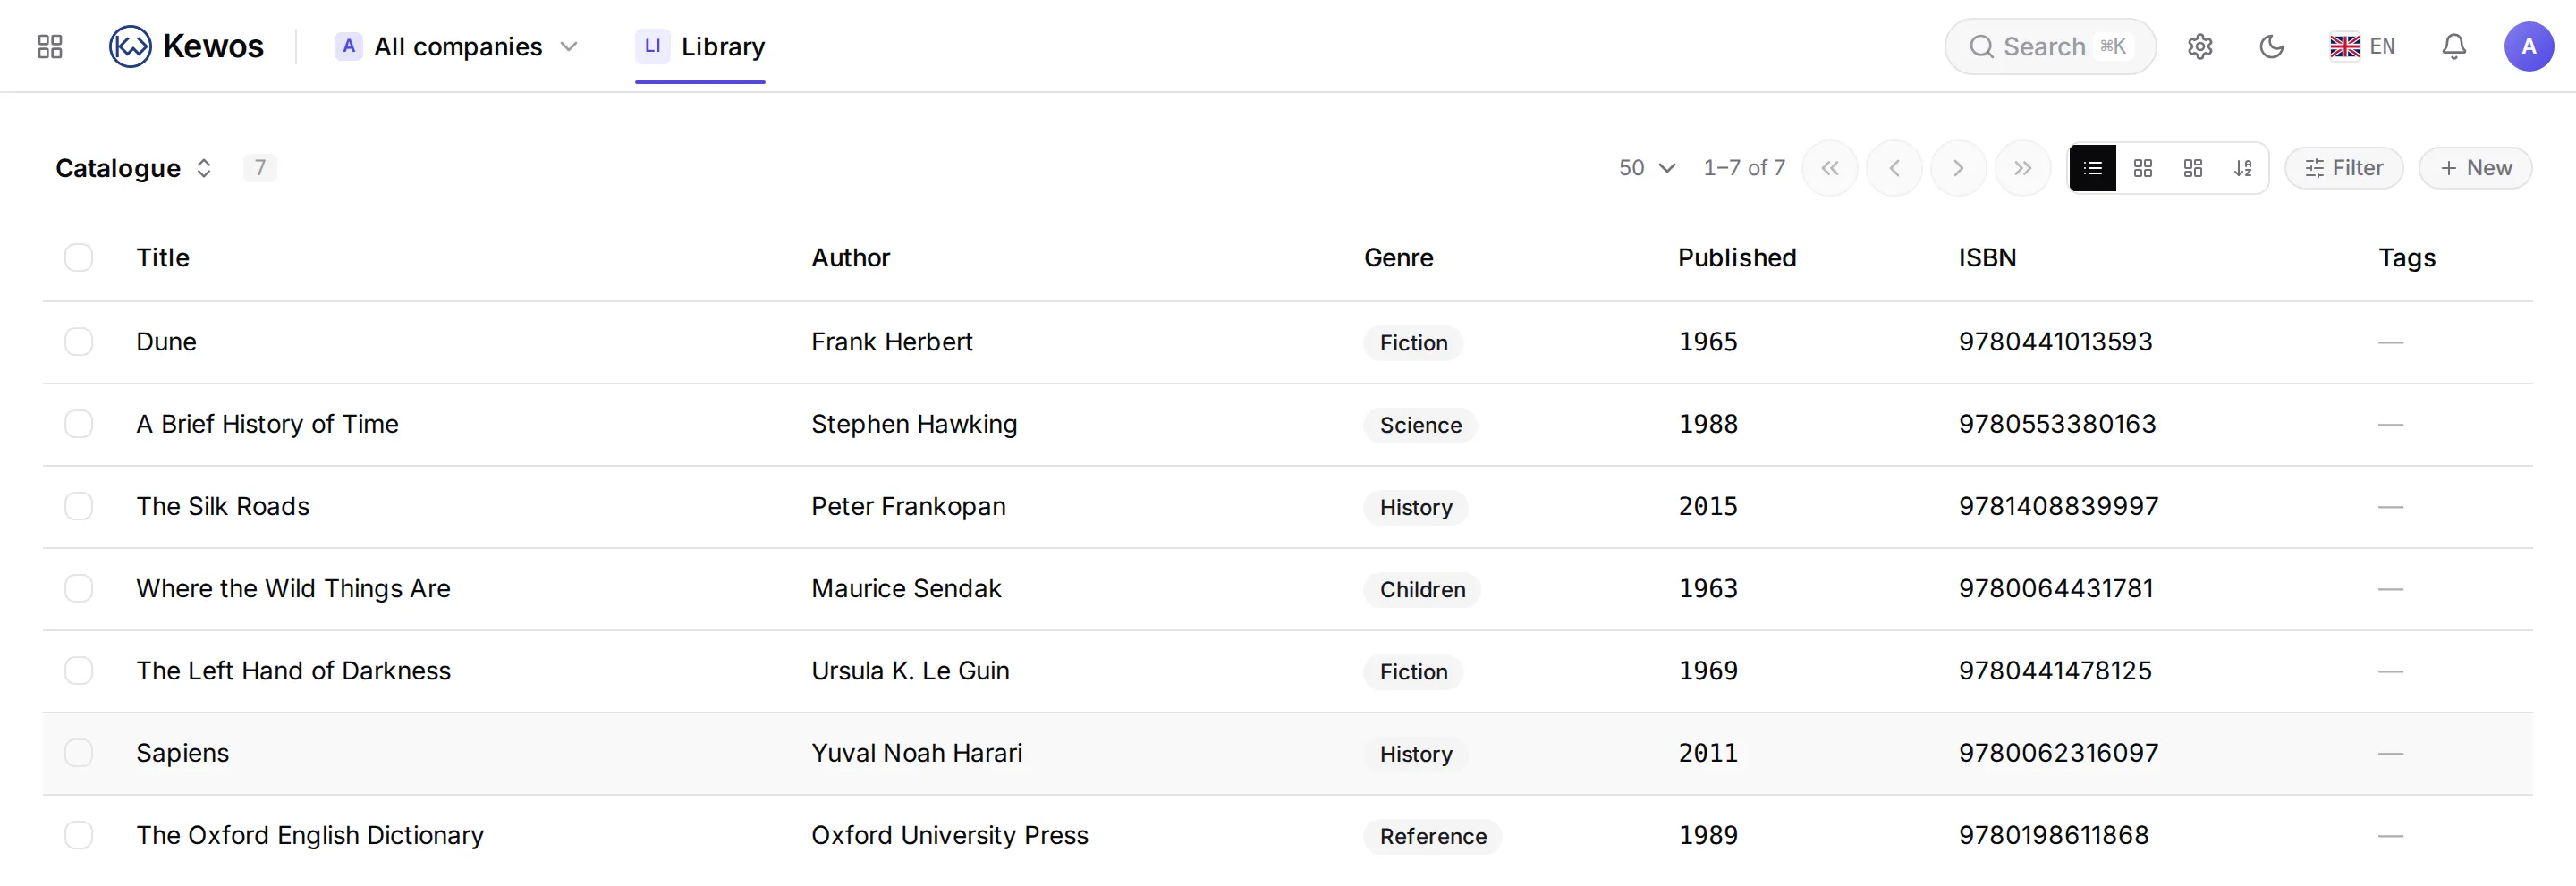
You declared five columns. Pagination, sorting, filtering, multi-select, the model picker, the “New” button and the view-kind switcher all come from the engine.
The form
{ "model": "library_title", "kind": "form", "sections": [ { "title": "section.work", "fields": ["name", "author", "genre", "published_year"] }, { "title": "section.reference", "fields": ["isbn", "summary"] } ]}model: library_titleviews: form: sections: - { title: section.work, fields: [name, author, genre, published_year] } - { title: section.reference, fields: [isbn, cover, summary] }view library_title form { section section.work fields name, author, genre, published_year, summary section section.reference fields isbn, cover}The same screen, one line per setting.
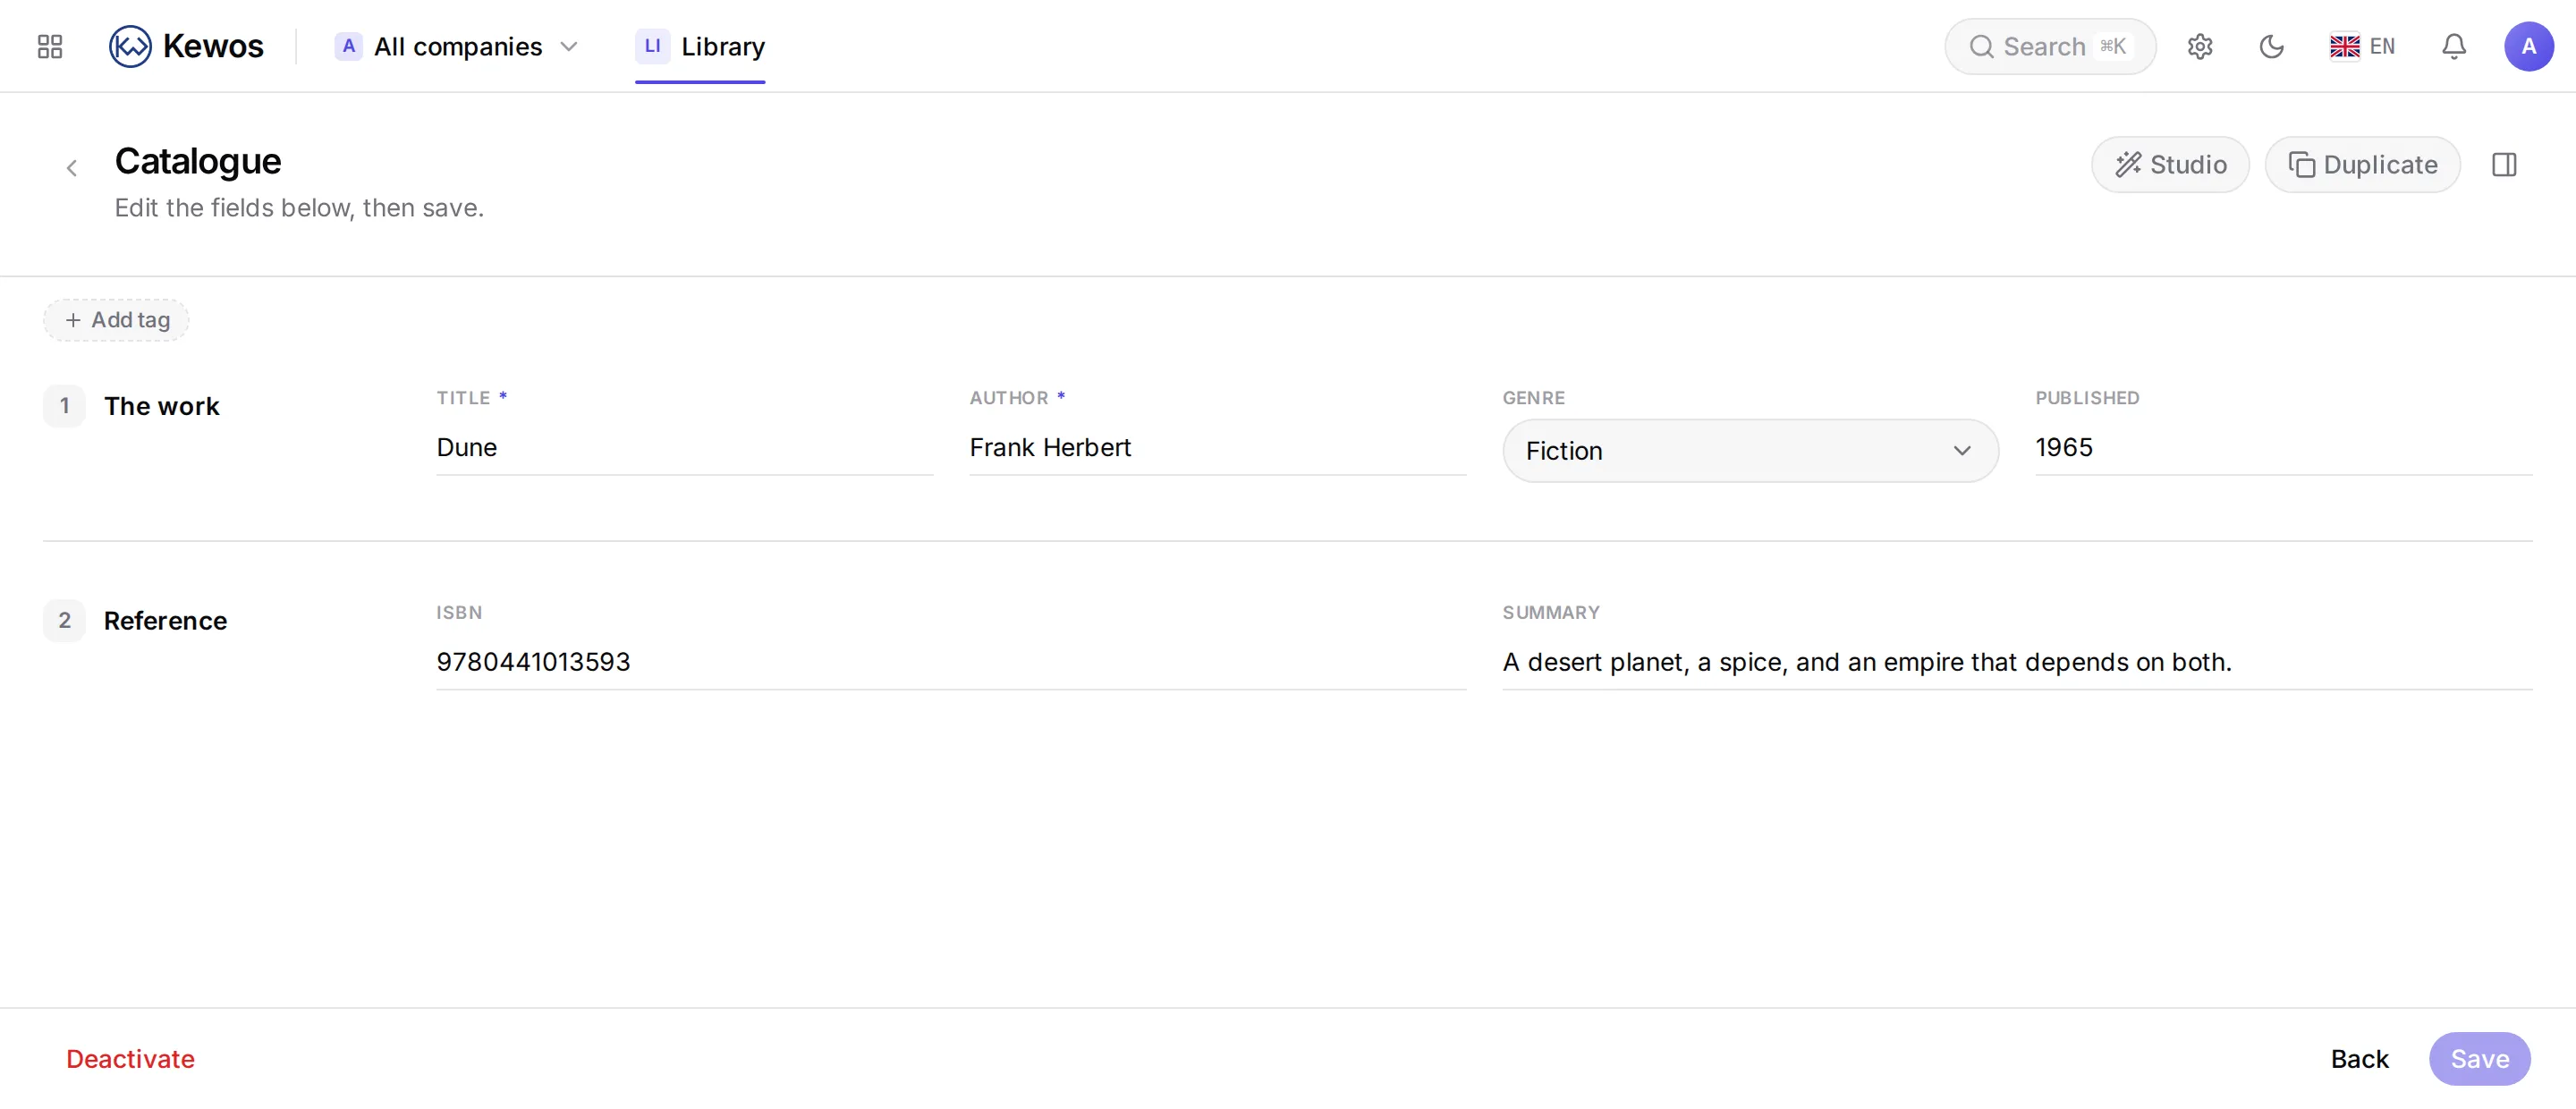
Each field took the control matching its type: a dropdown for the selection, a numeric field for the integer, a text area for the summary. You chose none of it.
layout accepts cards, accordion or tabs if you want the sections arranged differently.
The kanban
{ "model": "library_loan", "kind": "kanban", "groups_by": "state", "fields": ["copy_id", "member_id", "due_on"]}model: library_loanviews: kanban: { groups_by: state, card_fields: [copy_id, member_id, due_on] }view library_loan kanban { groups by state card copy_id, member_id, due_on}The same screen, one line per setting.
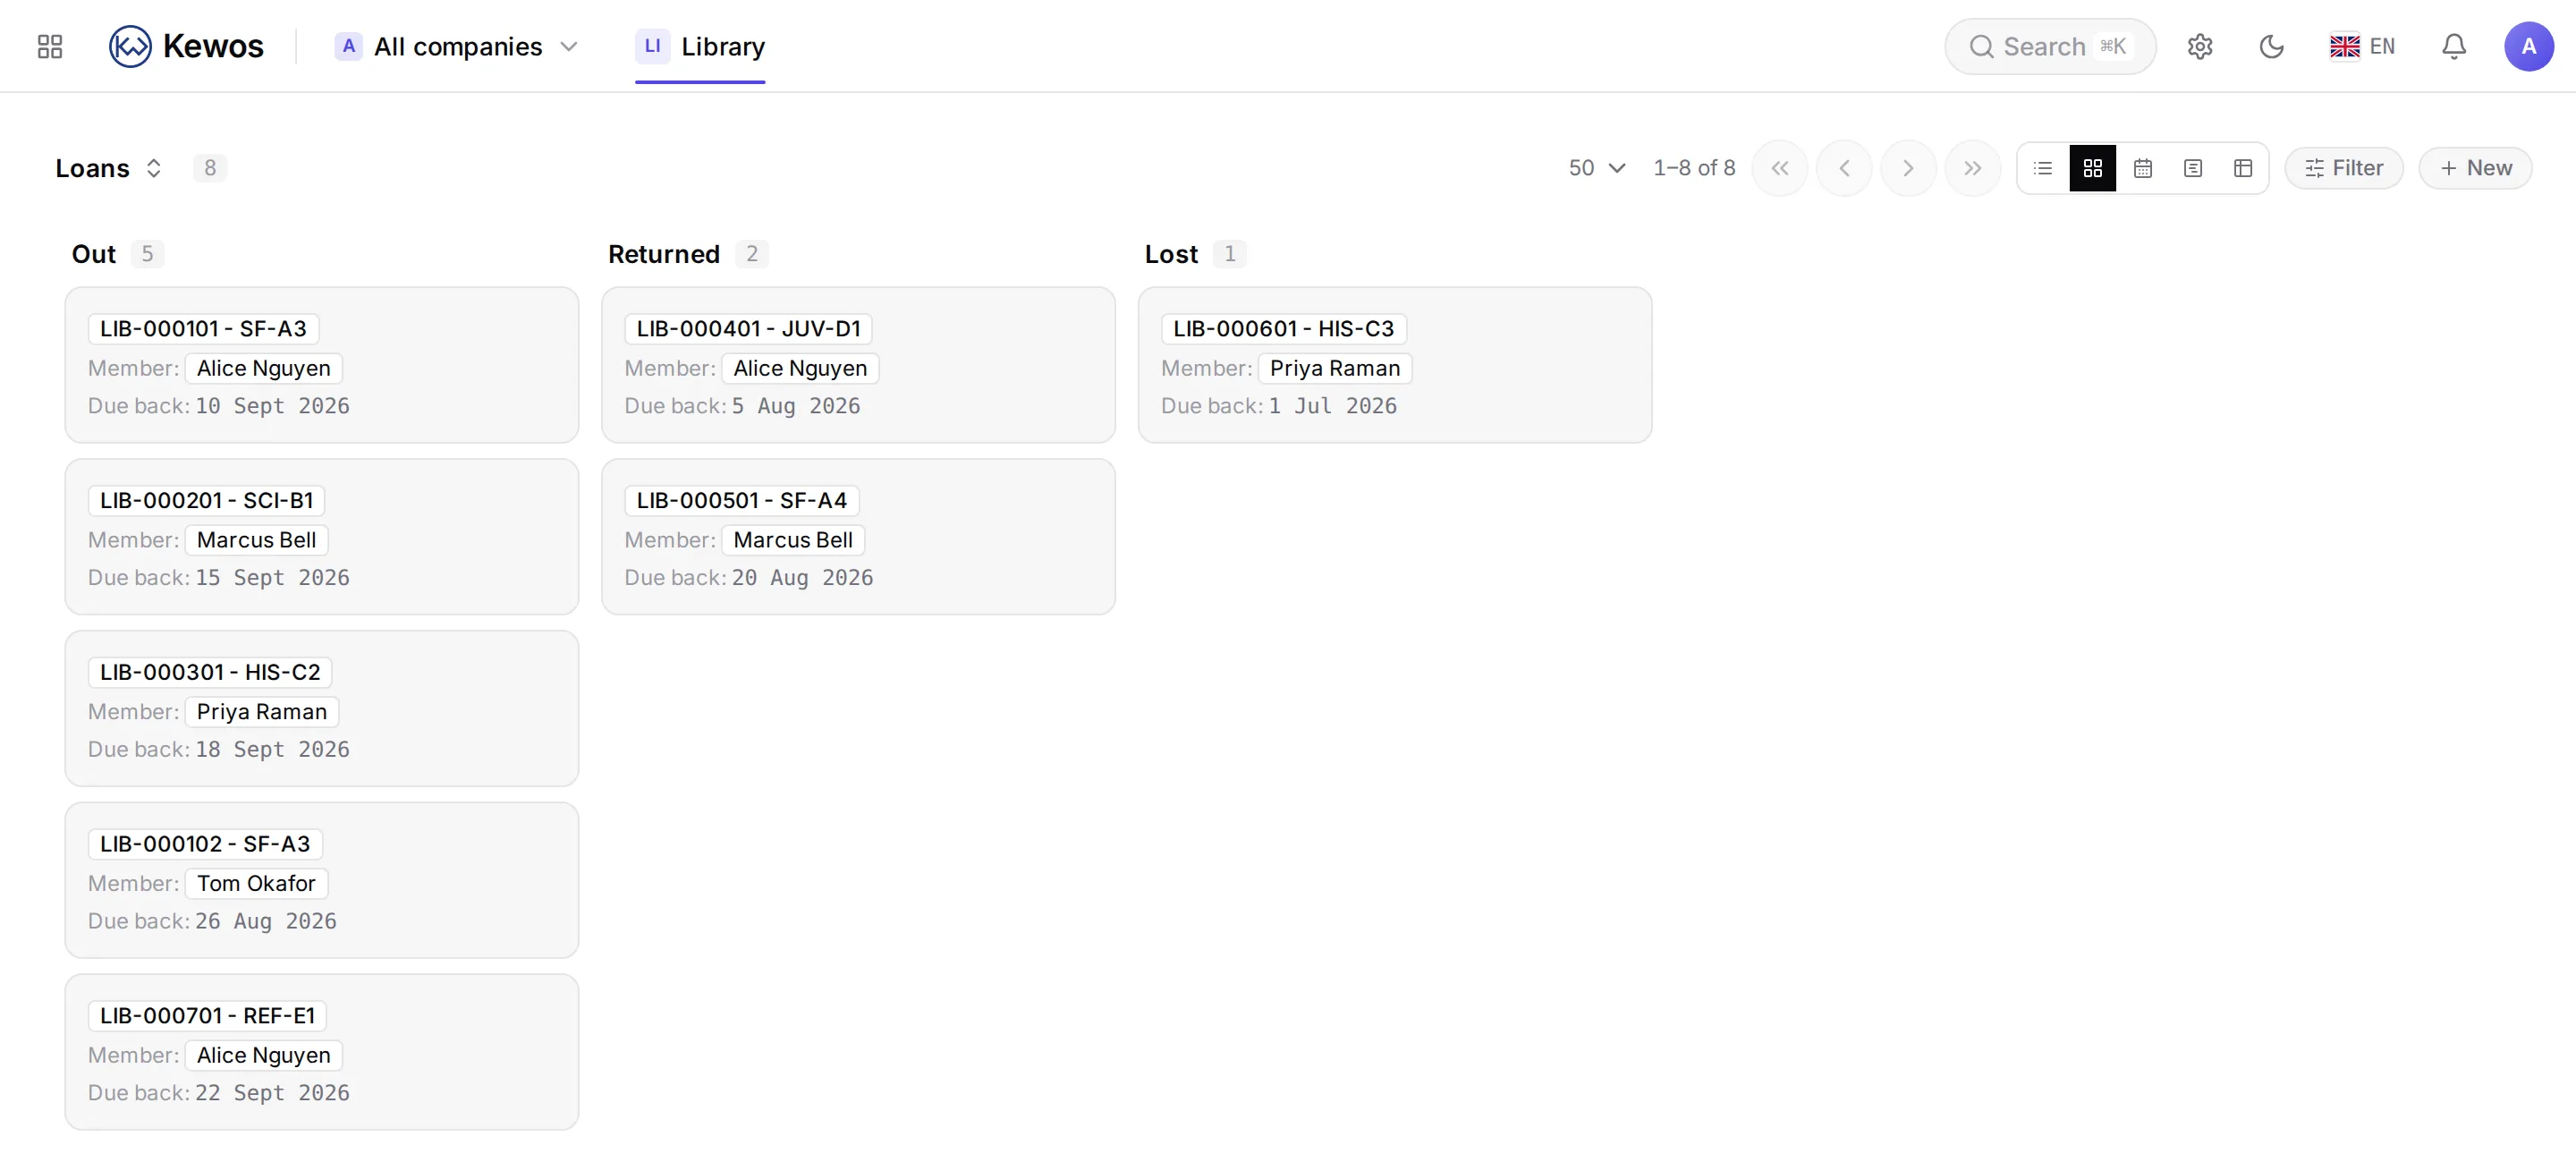
groups_by takes a selection field or a many2one: its values become the columns. Cards
move between columns, and the move writes the field.
Notice the headers carry the translated labels (“Out”, “Returned”, “Lost”) and their count, and the cards show the copy’s computed name rather than an id.
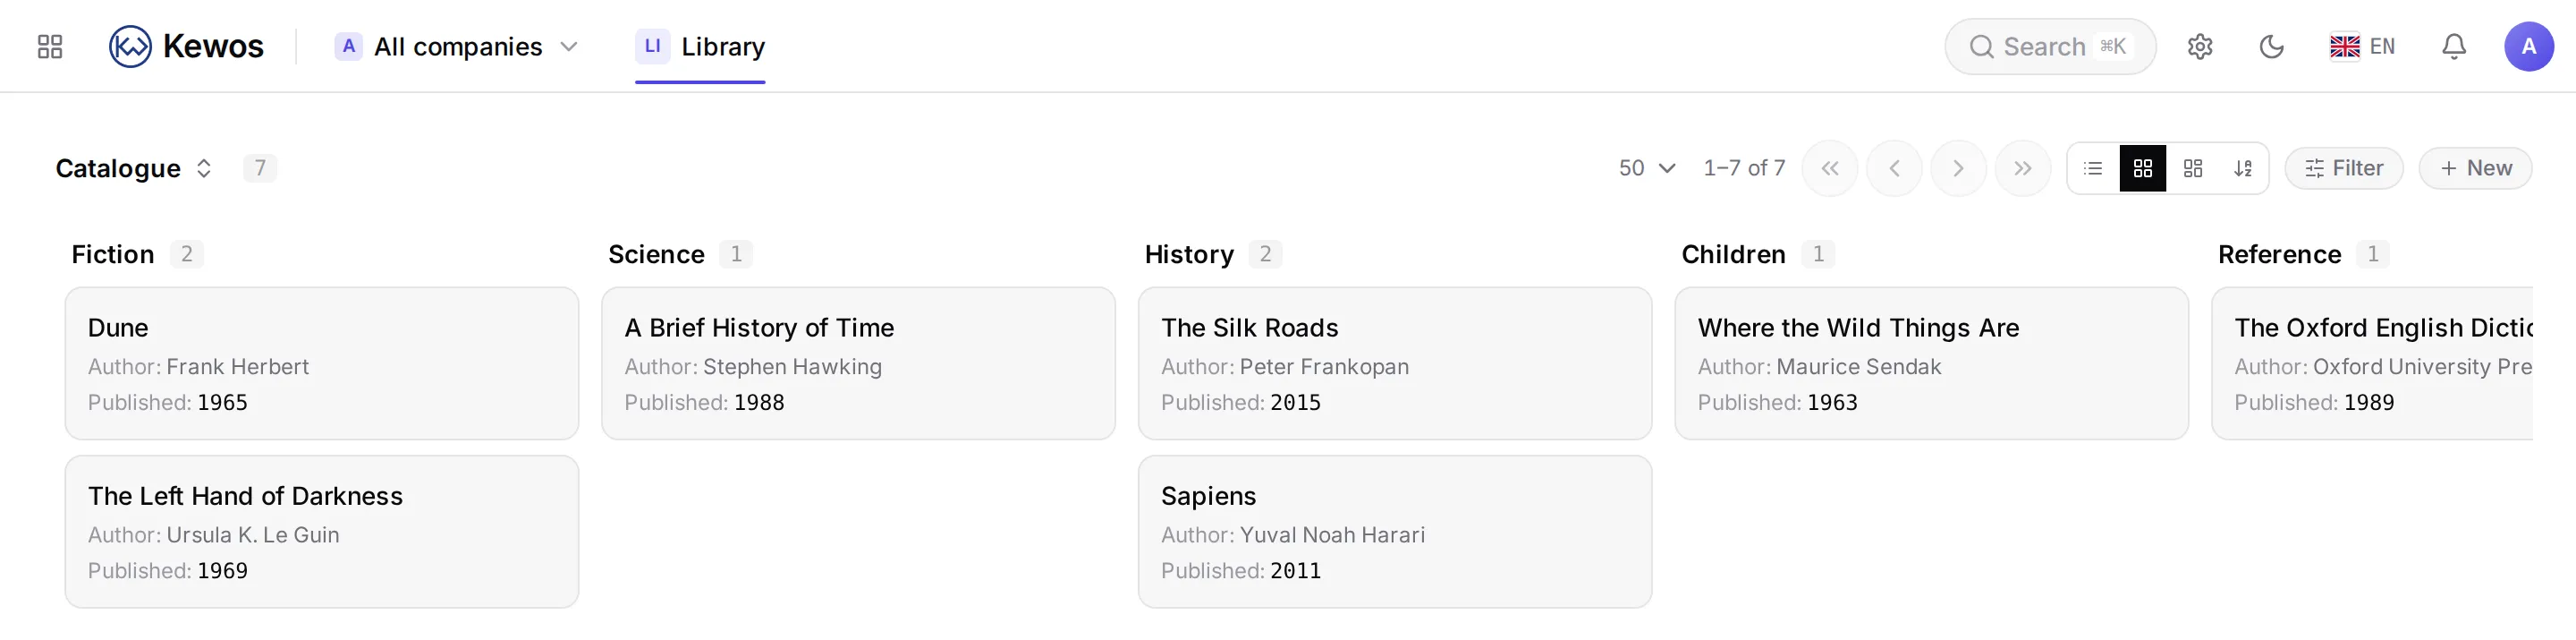
The same kind, on the catalogue, grouped by literary genre:
The calendar
{ "model": "library_loan", "kind": "calendar", "date_field": "due_on", "fields": ["copy_id", "member_id"]}model: library_loanviews: calendar: { date_field: due_on, card_fields: [copy_id, member_id] }view library_loan calendar { date due_on card copy_id, member_id}The same screen, one line per setting.
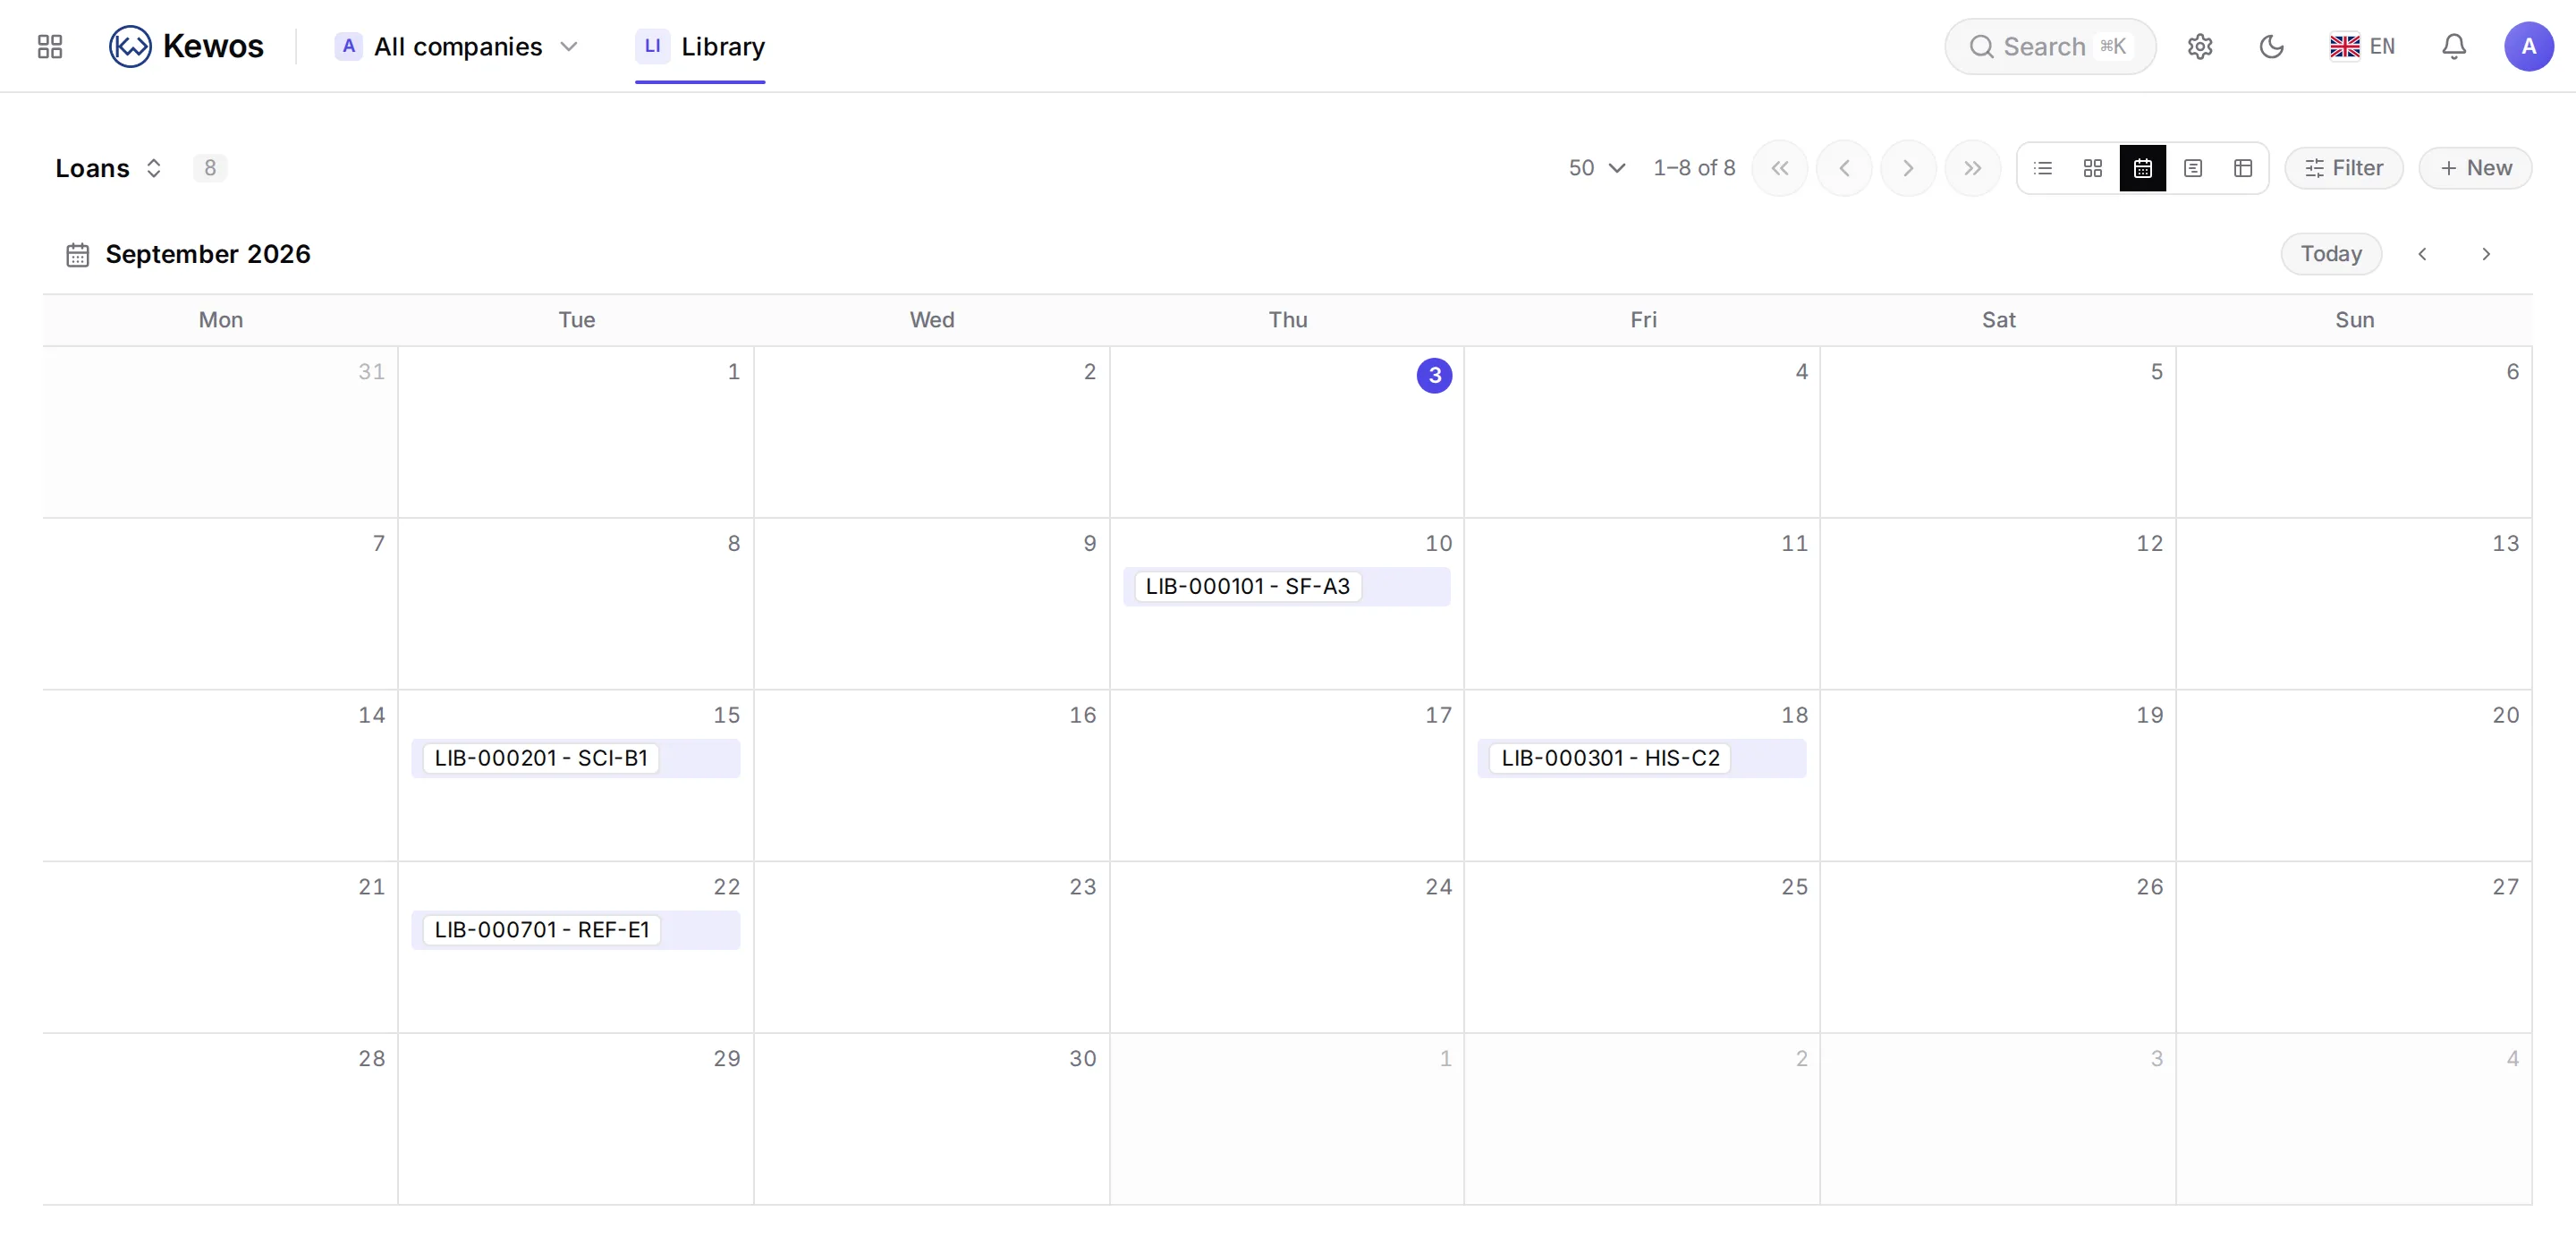
One required field: the date that places the record. Here, the due date, which gives the librarian the view they care about.
The timeline
{ "model": "library_loan", "kind": "timeline", "start_field": "taken_on", "end_field": "due_on", "label_field": "member_id", "group_by": "state", "default_zoom": "week"}model: library_loanviews: timeline: start_field: taken_on end_field: due_on label_field: member_id group_by: state default_zoom: weekview library_loan timeline { start taken_on end due_on label member_id groups by state zoom week}The same screen, one line per setting.
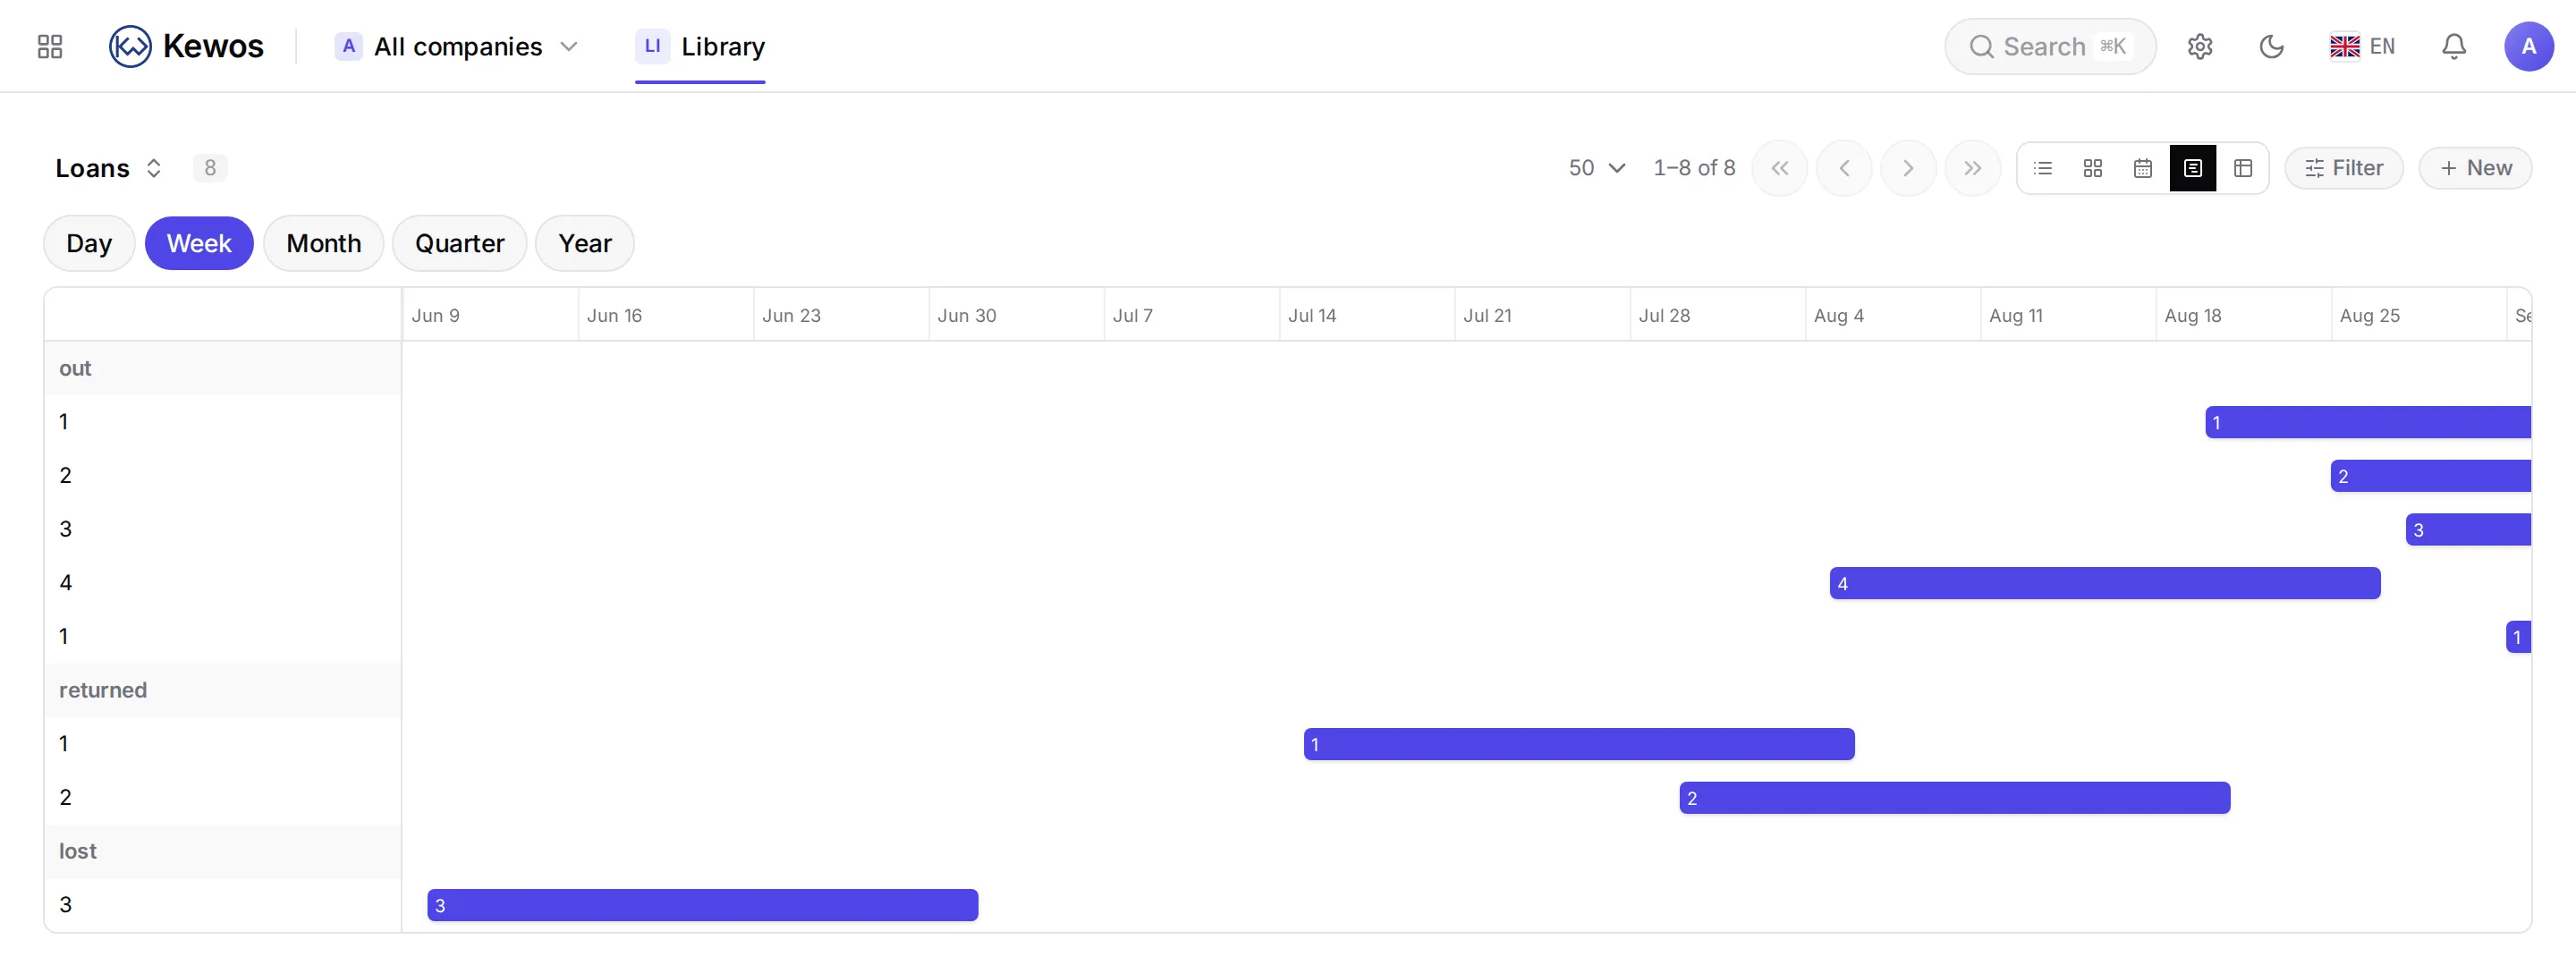
Each record becomes a bar between two dates. group_by makes the rows, default_zoom picks
the initial scale among day, week, month, quarter and year.
The timeline also accepts progress_field (a progress bar inside the bar), dependency_field
(arrows between bars) and milestone_field.
The pivot table
{ "model": "library_loan", "kind": "pivot", "row_field": "state", "col_field": "member_id", "agg": "count", "chart": "bar"}model: library_loanviews: pivot: { row_field: state, col_field: member_id, agg: count, chart: bar }view library_loan pivot { row state column member_id agg count}The same screen, one line per setting.

row_field alone is enough; col_field adds the second dimension. agg accepts count,
sum, avg, min and max, and measure_field then names the measured field. chart adds
a graph.
The dashboard
{ "model": "library_title", "kind": "dashboard", "title": "library_title.dashboard.title", "kpis": [ { "key": "titles", "label": "library_title.dashboard.titles", "op": "count" } ], "charts": [ { "key": "by_genre", "label": "library_title.dashboard.by_genre", "chart_type": "column", "groupby": "genre", "op": "count" } ]}Indicators and charts, on a single model. op accepts count, sum and avg; chart_type
accepts column, bar, line, area, pie and donut.
Note that label is a translation key, here as everywhere.
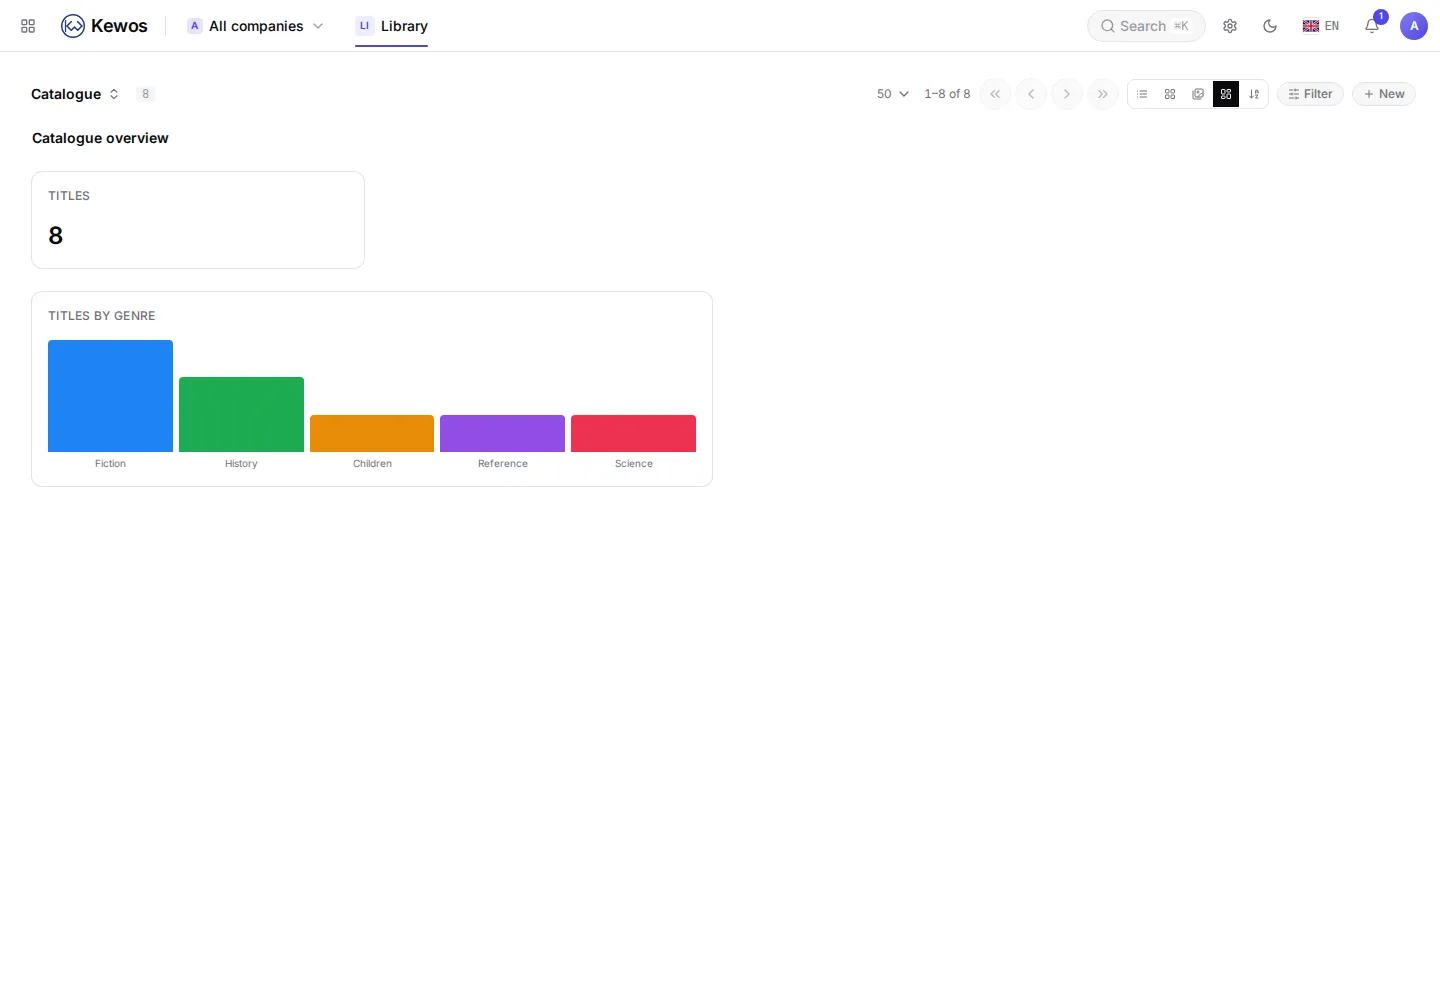
The bar labels come from the field’s choices, translated: “Fiction”, not fiction. It is
the same word the list and the kanban show for that column, and it was wrong until this
screenshot was taken.
The workload
{ "model": "library_loan", "kind": "workload", "group_by": "member_id", "start_field": "taken_on", "end_field": "due_on", "measure_field": "fine_amount", "capacity_per_period": 40, "default_zoom": "week"}A timeline that accumulates: it answers “who is overloaded over which period”.
capacity_per_period draws the threshold beyond which a period is over capacity.
The gallery
This one is not declared: it appears as soon as the model has an image.
registry.register_model( "library_title", module="library", fields=[ ..., FileField( name="cover", allowed_extensions=("png", "jpg", "jpeg", "webp", "svg"), max_size_bytes=5 * 1024 * 1024, ), ], # This one line is what makes the gallery view exist. image_field="cover",)No view file, no configuration: image_field names the field carrying the model’s image, and
the engine adds the gallery to the offered views.
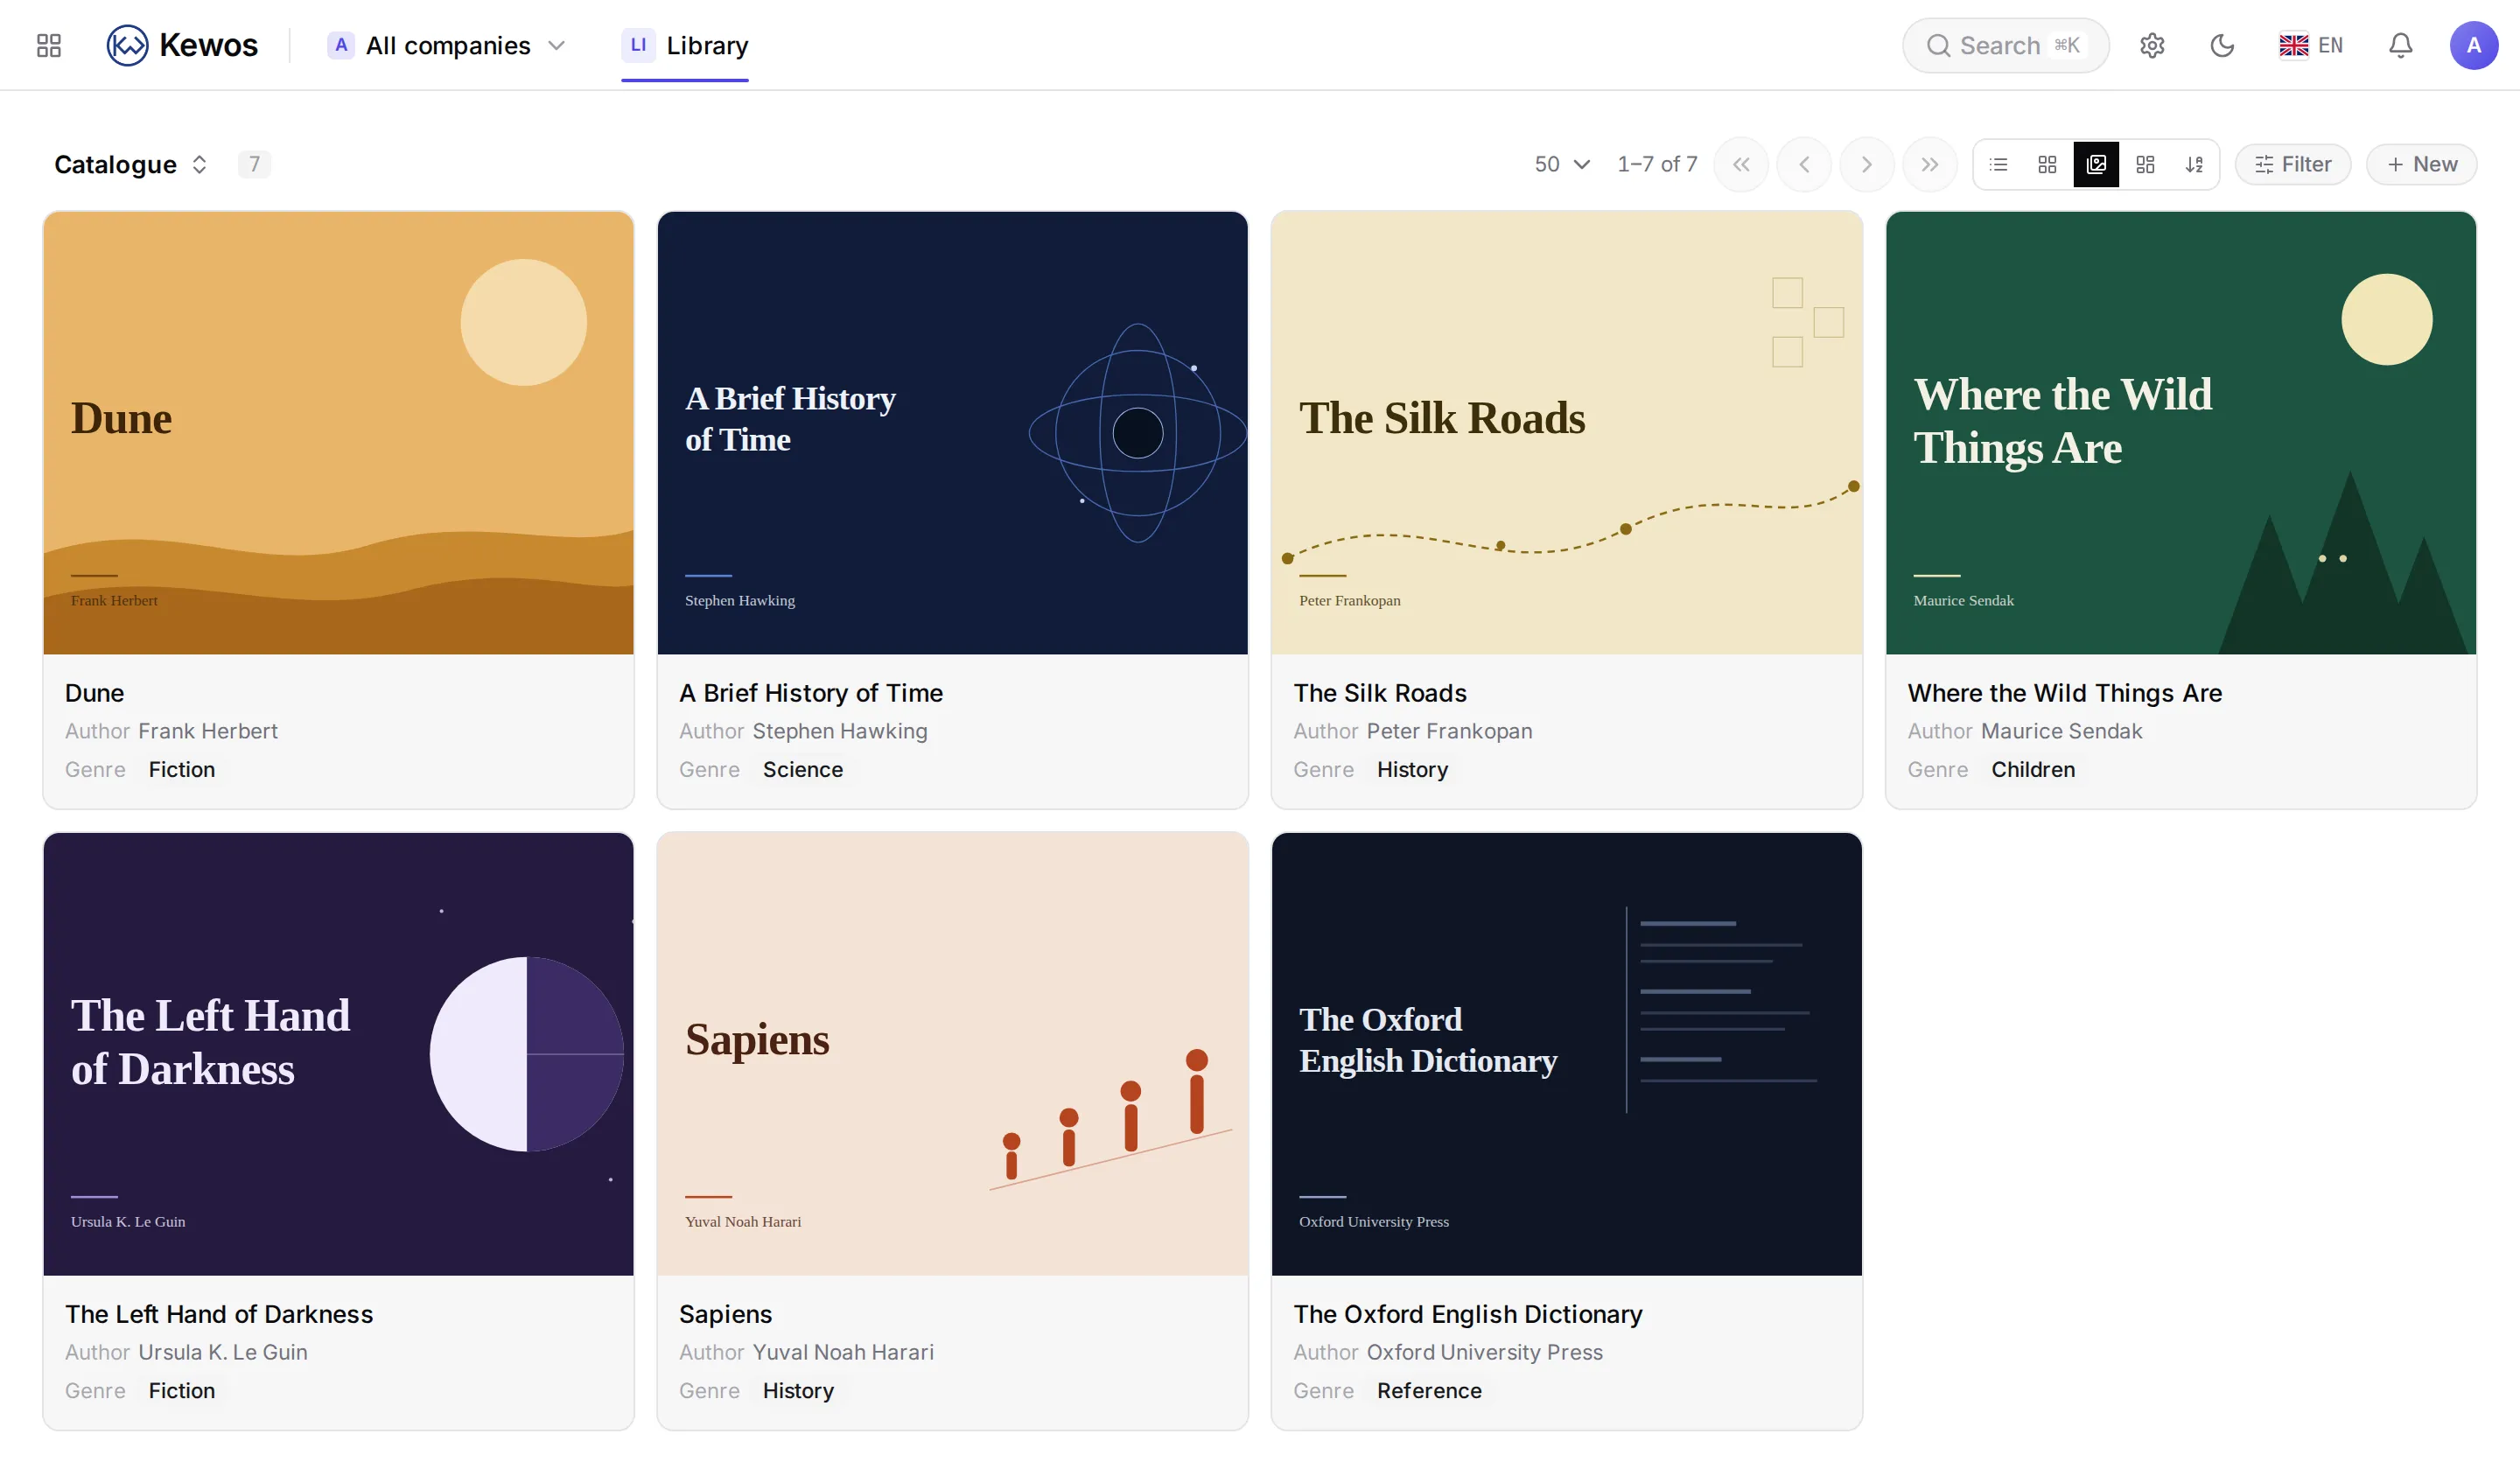
The same image doubles as the avatar elsewhere: in a relation picker, in a record header, everywhere the product shows a work.
The home dashboard
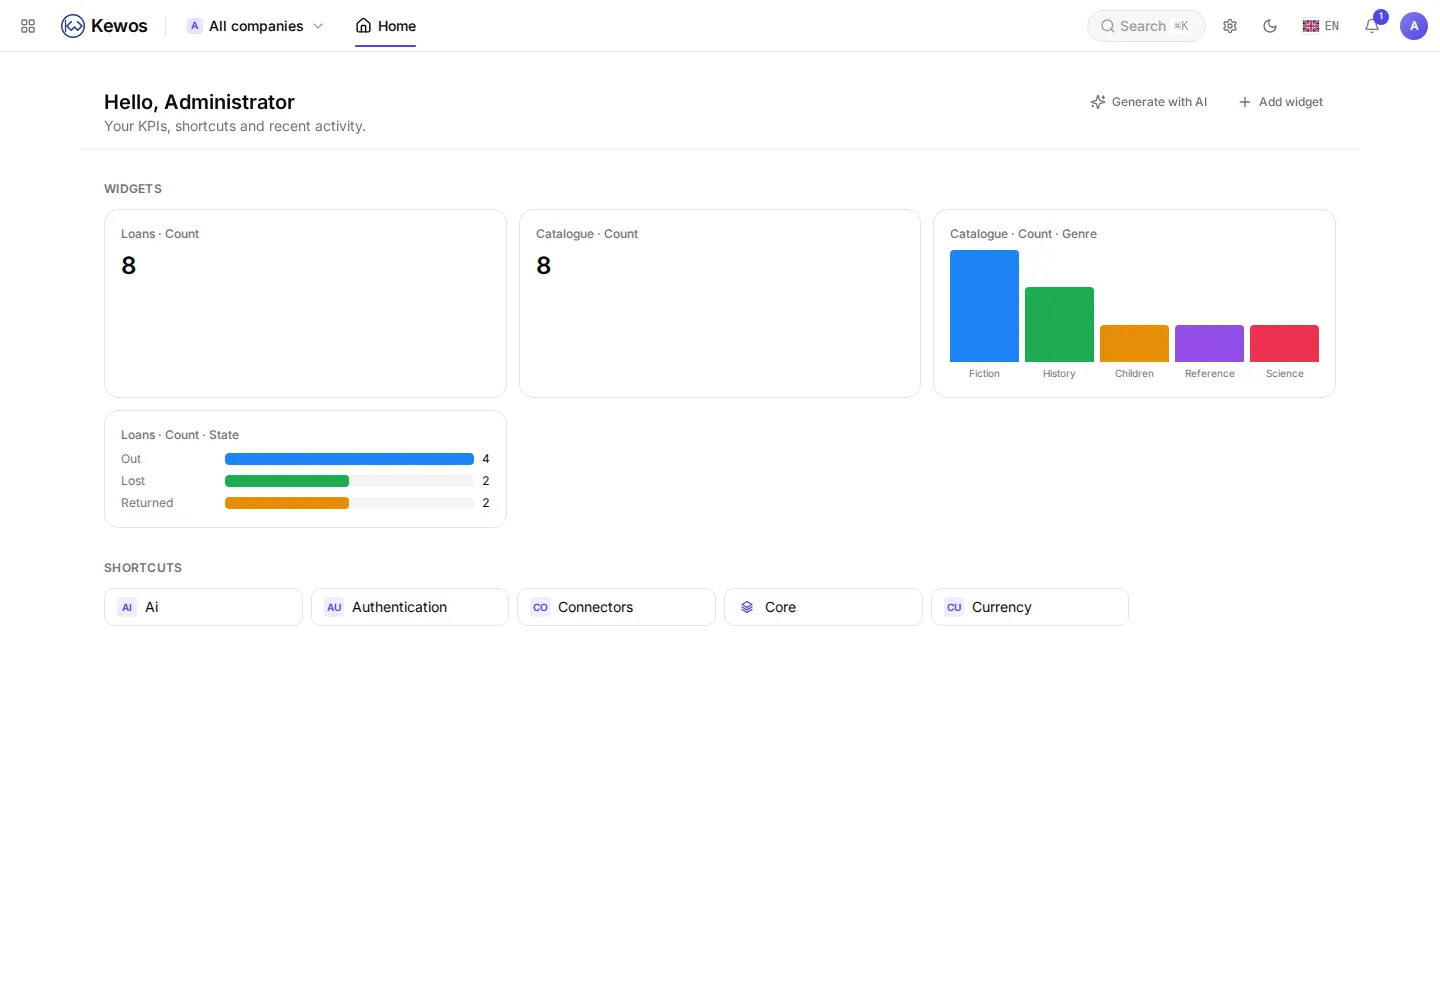
The home screen belongs to nobody: it is the page a user lands on, and its widgets come from every installed module. Its layout is a user preference, so a module cannot impose one. It can propose a starting point, and that is what somebody who has configured nothing sees.
modules/library/home.json:
{ "widgets": [ { "kind": "metric", "model": "library_loan", "op": "count" }, { "kind": "metric", "model": "library_title", "op": "count" }, { "kind": "chart", "model": "library_title", "op": "count", "group": "genre", "display": "column" }, { "kind": "chart", "model": "library_loan", "op": "count", "group": "state", "display": "donut" } ]}Nothing to call: the kernel reads that file when the module loads, the way it reads
onboarding.json.
The two rules that make this acceptable
It is a default, never a write. The file is not poured into anybody’s preference. It serves only while the user has expressed nothing.
The moment they arrange their dashboard, theirs is the only one that counts. An upgrade of your module must not rearrange a screen somebody set up. Same rule as a flow shipped in step 12.
The widget kinds
metric (a number), chart (a split, with group), timeseries (a trend, with date and
interval), plus the system widgets notifications, tasks and ai_briefing, which are
about the user and therefore carry no model.
A badly declared widget is refused at load, with the module named. That is not zeal: a
widget with no model queries /undefined and takes the whole grid down, so the frontend drops
it — which means a typo would simply not appear, and nobody would know why.
The map
This one is neither a declarable kind nor a kind that appears on its own: it is a custom view. The mechanism is different and worth understanding, because it is the door to everything the generic engine cannot do.
A view kind is rendered by the engine from a JSON file. A custom view instead names a generic frontend component and hands it a configuration. The component already exists in the product; your module only says “for this model, on this surface, take that one, with these fields”. Still no frontend to write, and still nothing specific to your module on screen.
The library wants to see where its members live, to decide where to put a return box.
Two fields on the model:
DecimalField(name="lat", nullable=True, precision=9, scale=6),DecimalField(name="lng", nullable=True, precision=9, scale=6),Six decimals is about ten centimetres, far more than a library needs, and the precision a coordinate column usually carries.
Then a views/library_member.custom.json file:
[ { "model": "library_member", "surface": "map", "component": "map", "config": { "lat_field": "lat", "lng_field": "lng", "label_field": "name", "subtitle_field": "card_number", "state_field": "status" } }]And one line in the module’s register(), next to the one that loads the views:
register_custom_views_from_dir(_MODULE_DIR / "views")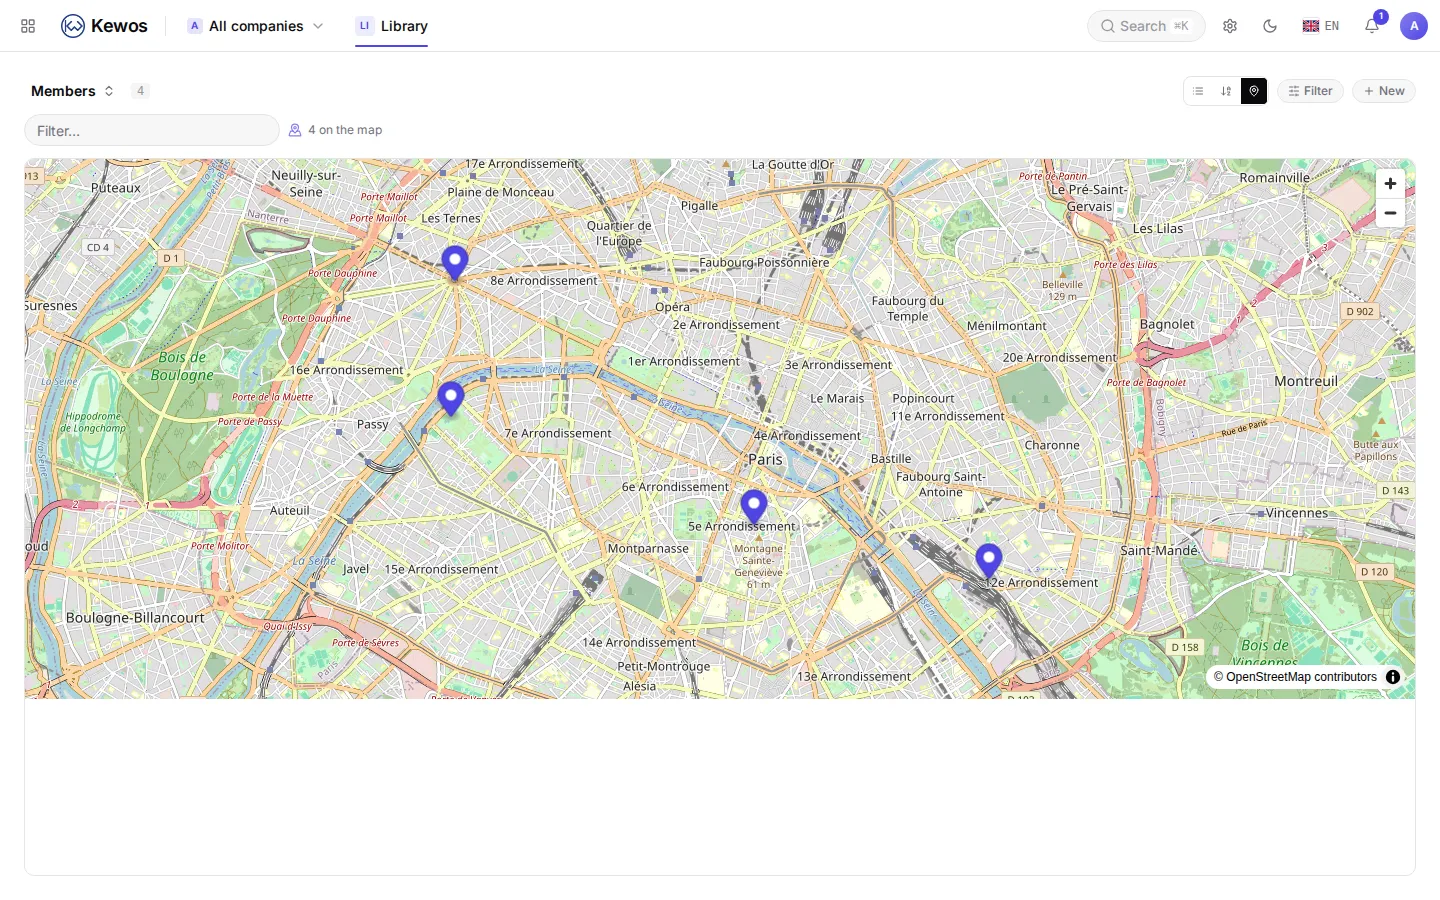
A Map button appeared next to the list and the A-Z index. The counter says how many records are placed: members without coordinates do not vanish quietly, they are counted apart. Clicking a marker opens the record.
The base map is not in your module either: it comes from GET /api/v1/geo/map-config, set by
the instance. By default those are OpenStreetMap tiles, and the attribution in the bottom right
is required, not decoration.
The table of eight
| Kind | Required | Optional |
|---|---|---|
list | fields | name |
form | fields | sections, layout |
kanban | groups_by, fields | name |
calendar | date_field | fields |
timeline | start_field, end_field | label_field, group_by, progress_field, dependency_field, milestone_field, default_zoom |
workload | group_by, start_field, end_field | measure_field, capacity_per_period, default_zoom |
pivot | row_field | col_field, measure_field, agg, chart |
dashboard | kpis, charts | title |
Two more kinds have no declaration file: the engine offers them when the model qualifies.
| Kind | Appears when |
|---|---|
gallery | The model declares an image_field. |
alphabetic | The model has a text field serving as a title. |
And the map is neither: it is a custom view, declared in a *.custom.json file, naming a
frontend component instead of being rendered by the engine.
What the server actually sends
This is where the model comes into its own.
curl -H "Authorization: Bearer $TOKEN" \ "http://127.0.0.1:8080/api/v1/views/library_loan/effective?kind=list"{"model":"library_loan","kind":"list","body":{"columns":[ {"name":"copy_id","label":"Copy id","label_i18n_key":"library_loan.copy_id", "type":"many2one","required":true,"target_model":"library_copy","origin":"system"}, {"name":"state","label":"State","label_i18n_key":"library_loan.state", "type":"selection","options":[ {"value":"out","label":"Out","i18n_key":"library_loan.state.out"}]}]}}The server does not send only data: it sends each column’s type, its label, its translation key, its relation target and its options. The administration needs to know no field name in advance.
That is why a module appears without touching the frontend, and also why a module cannot impose its own layout: it describes, the engine renders.
Next
Making it visible. Because at this point, your module has fourteen screens nobody will find.